Tech in the Workforce
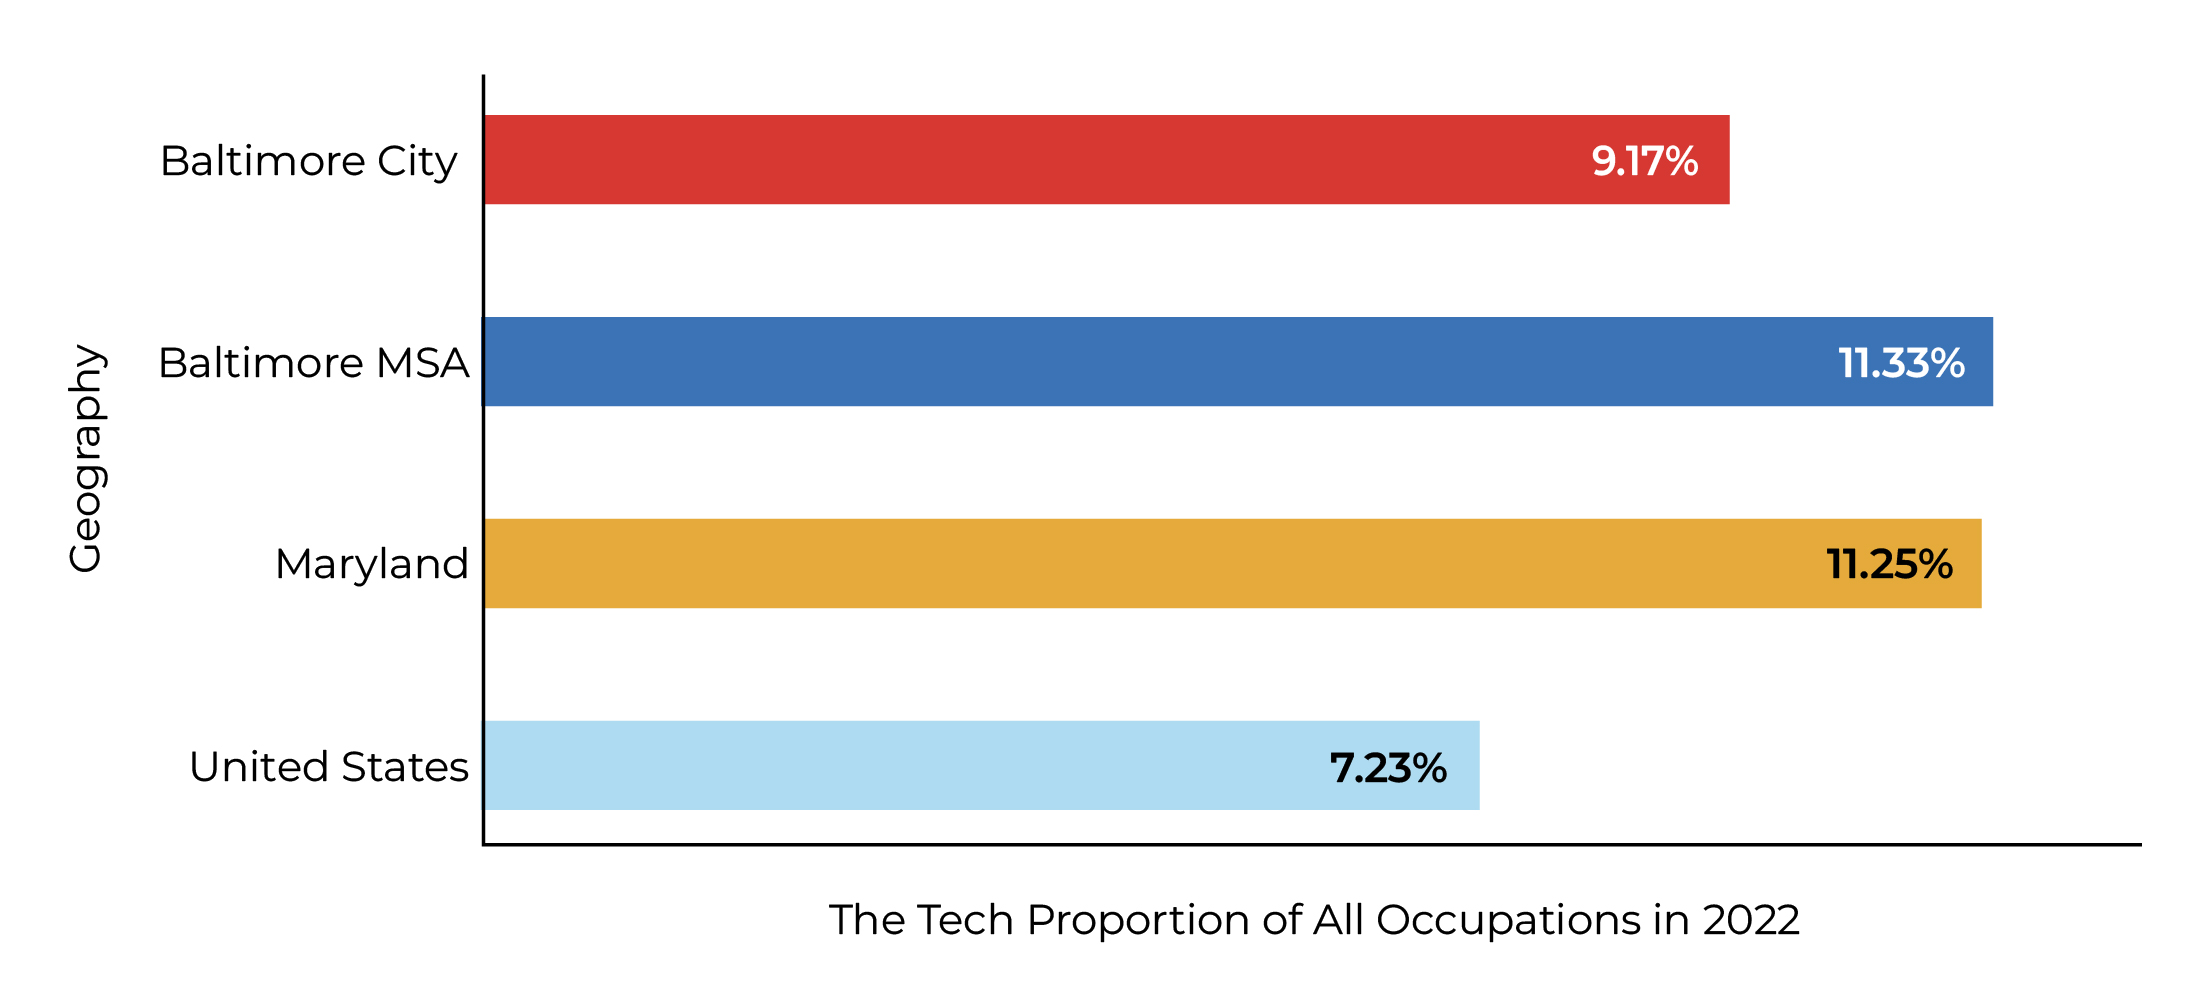
UpSurge defines the “tech” workforce as Computer and Mathematical Occupations, Architecture and Engineering Occupations, and Life, Physical, and Social Science Occupations, as reported by the American Community Survey.
The Tech Proportion of Employed People in 2022
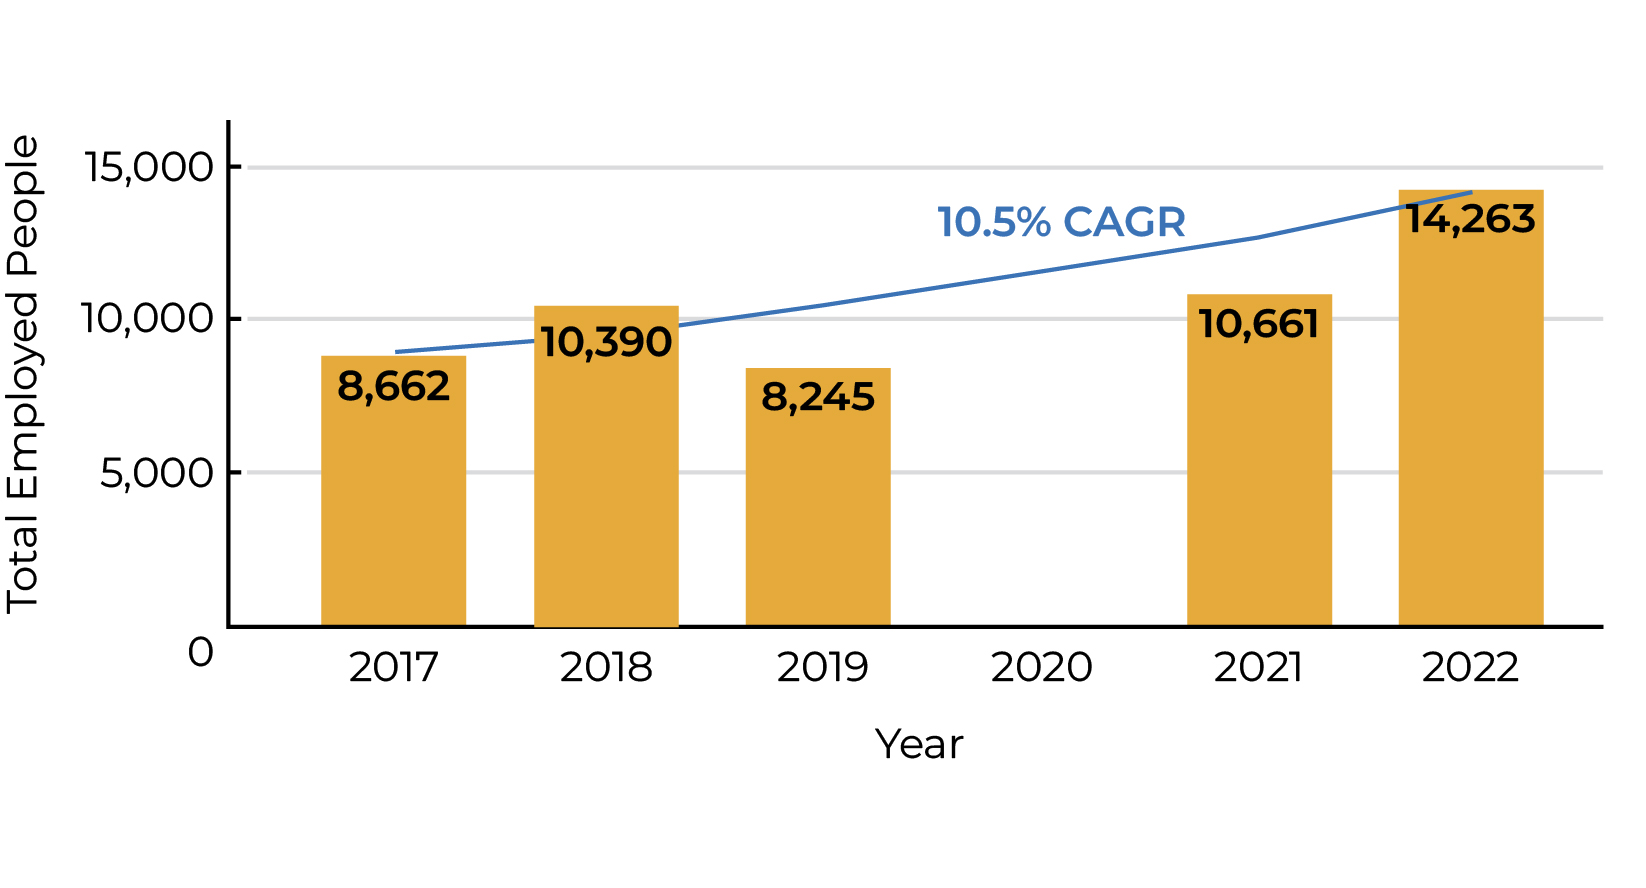
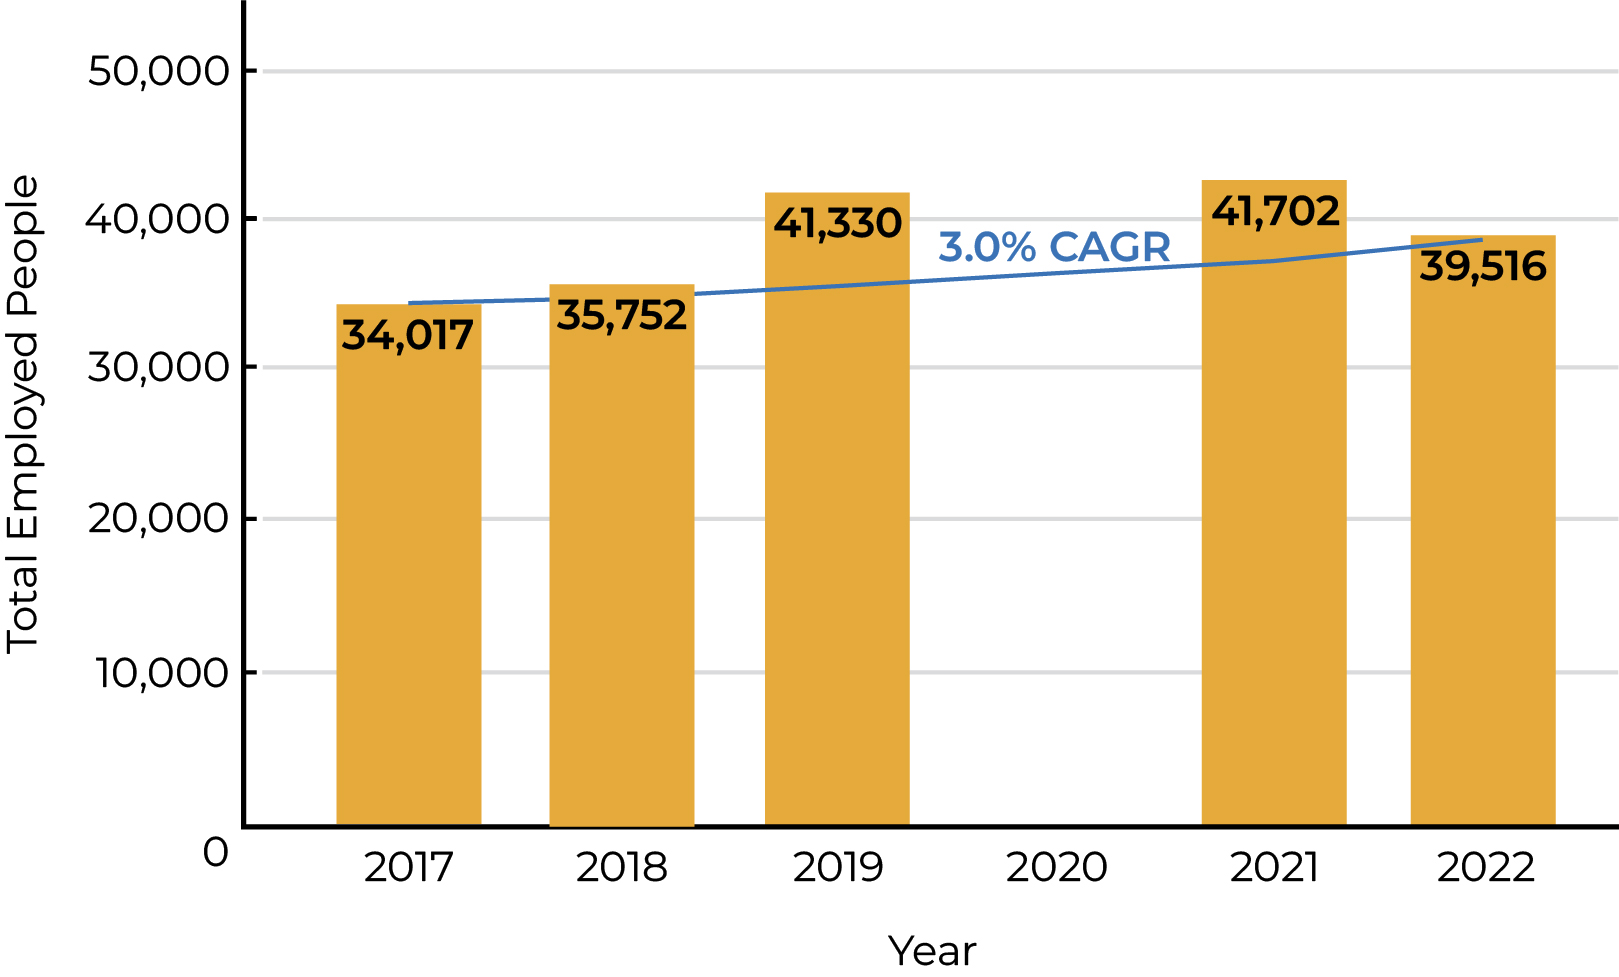
5-Year Growth of the Tech Proportion of Employed People

Race & Gender Representation in the Tech Sector
This section reflects employment data from the American Community Survey. Demographic groups included here represent more than 5% of the total workforce.

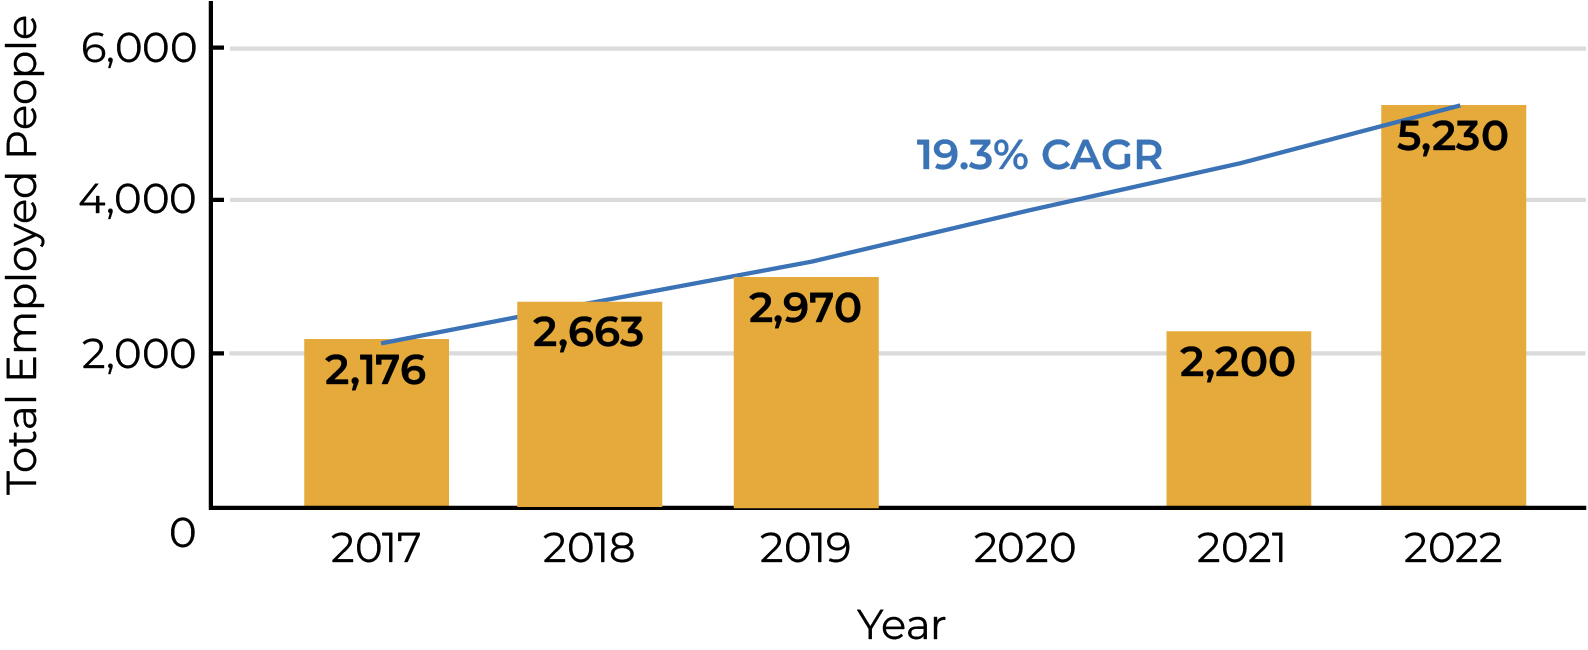
Greatest Increase in Tech Jobs, by Occupation Group, Race & Gender
The ACS does not report 2020 data due to bias from the COVID-19 pandemic. These charts measure employment change as the net change in jobs from 2017 to 2022.
Black Male Computer & Mathematical
White Male Computer & Mathematical
Black Male Architecture & Engineering
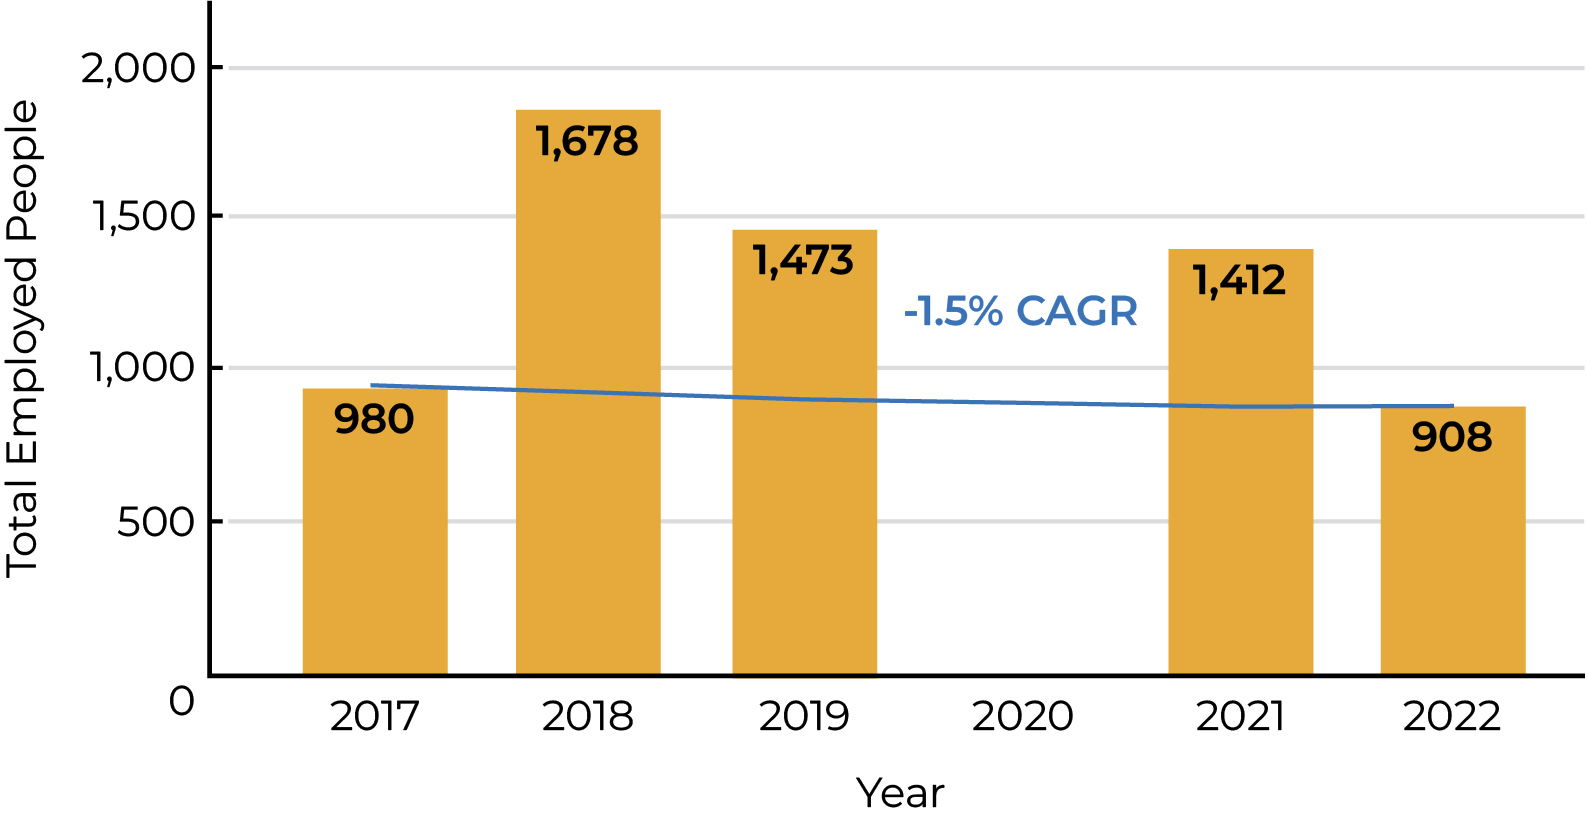
Greatest Decrease in Tech Jobs, by Occupation Group, Race & Gender
These charts measure employment change as the net change in jobs from 2017 to 2022.
White Female Architecture & Engineering
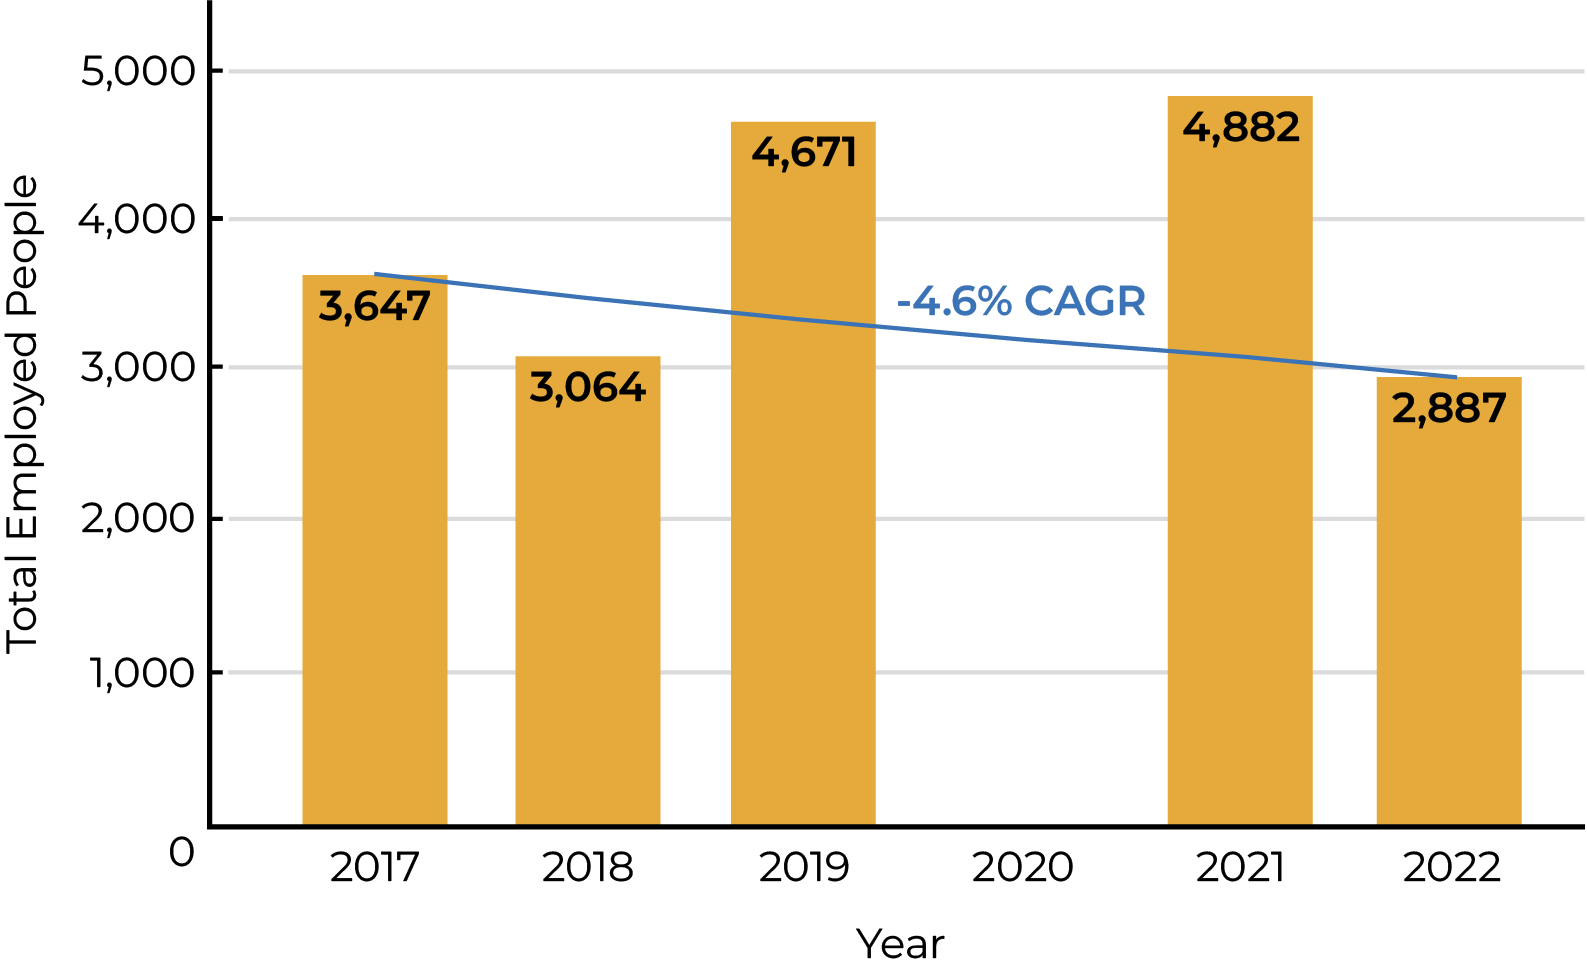
Asian Female Architecture & Engineering
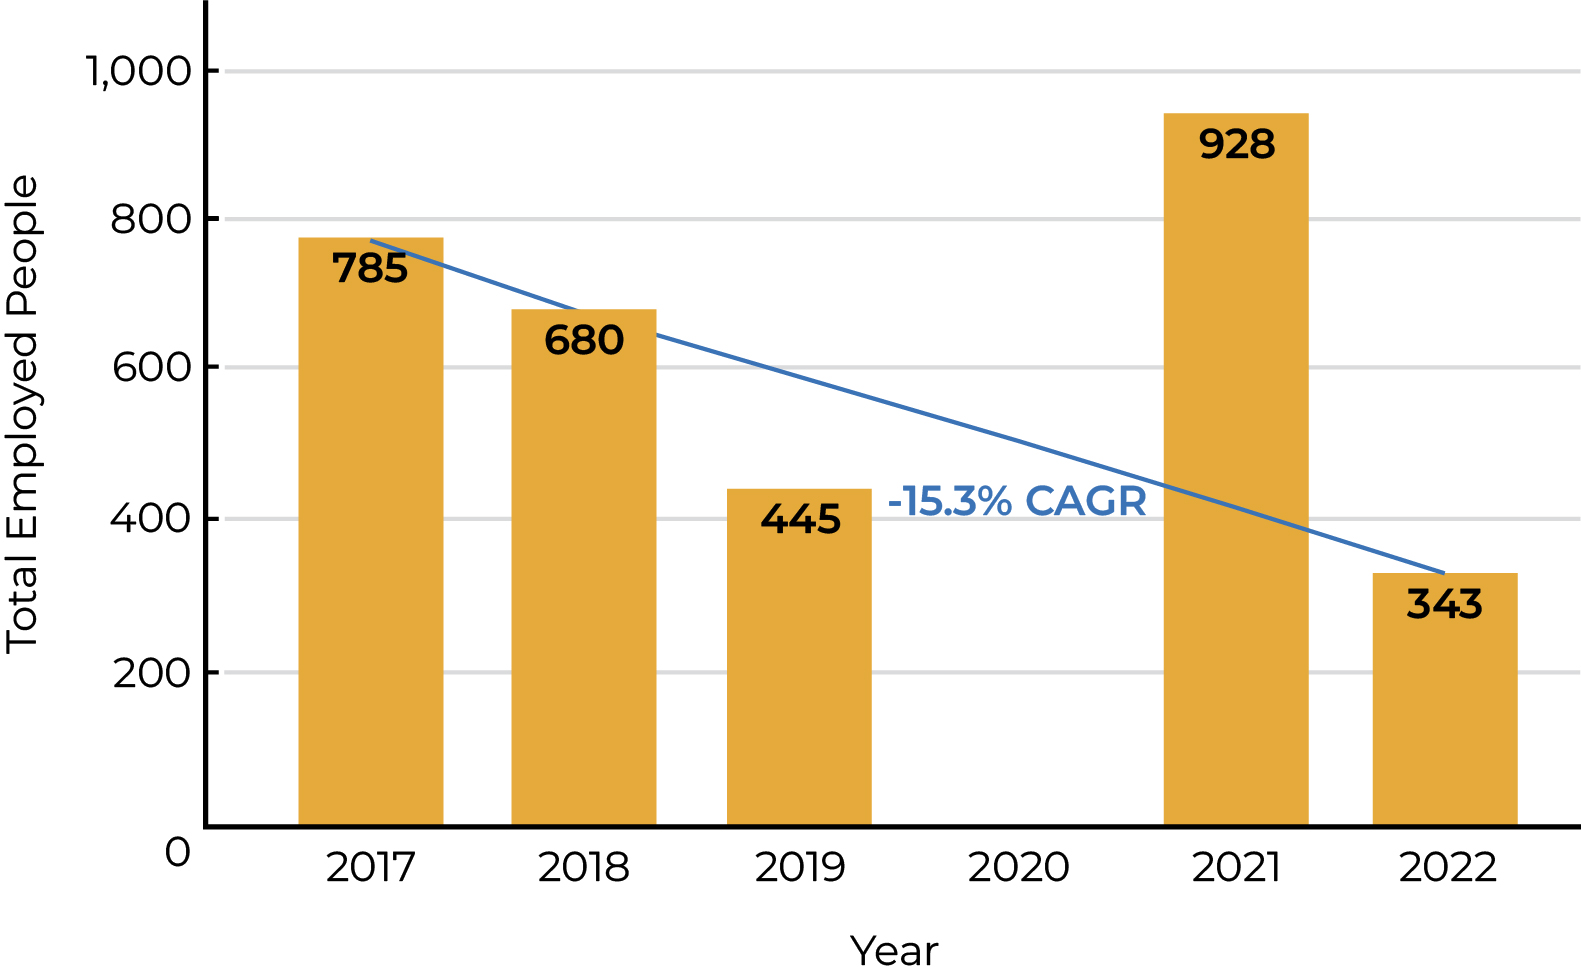
Black Male Life, Physical, & Social Science
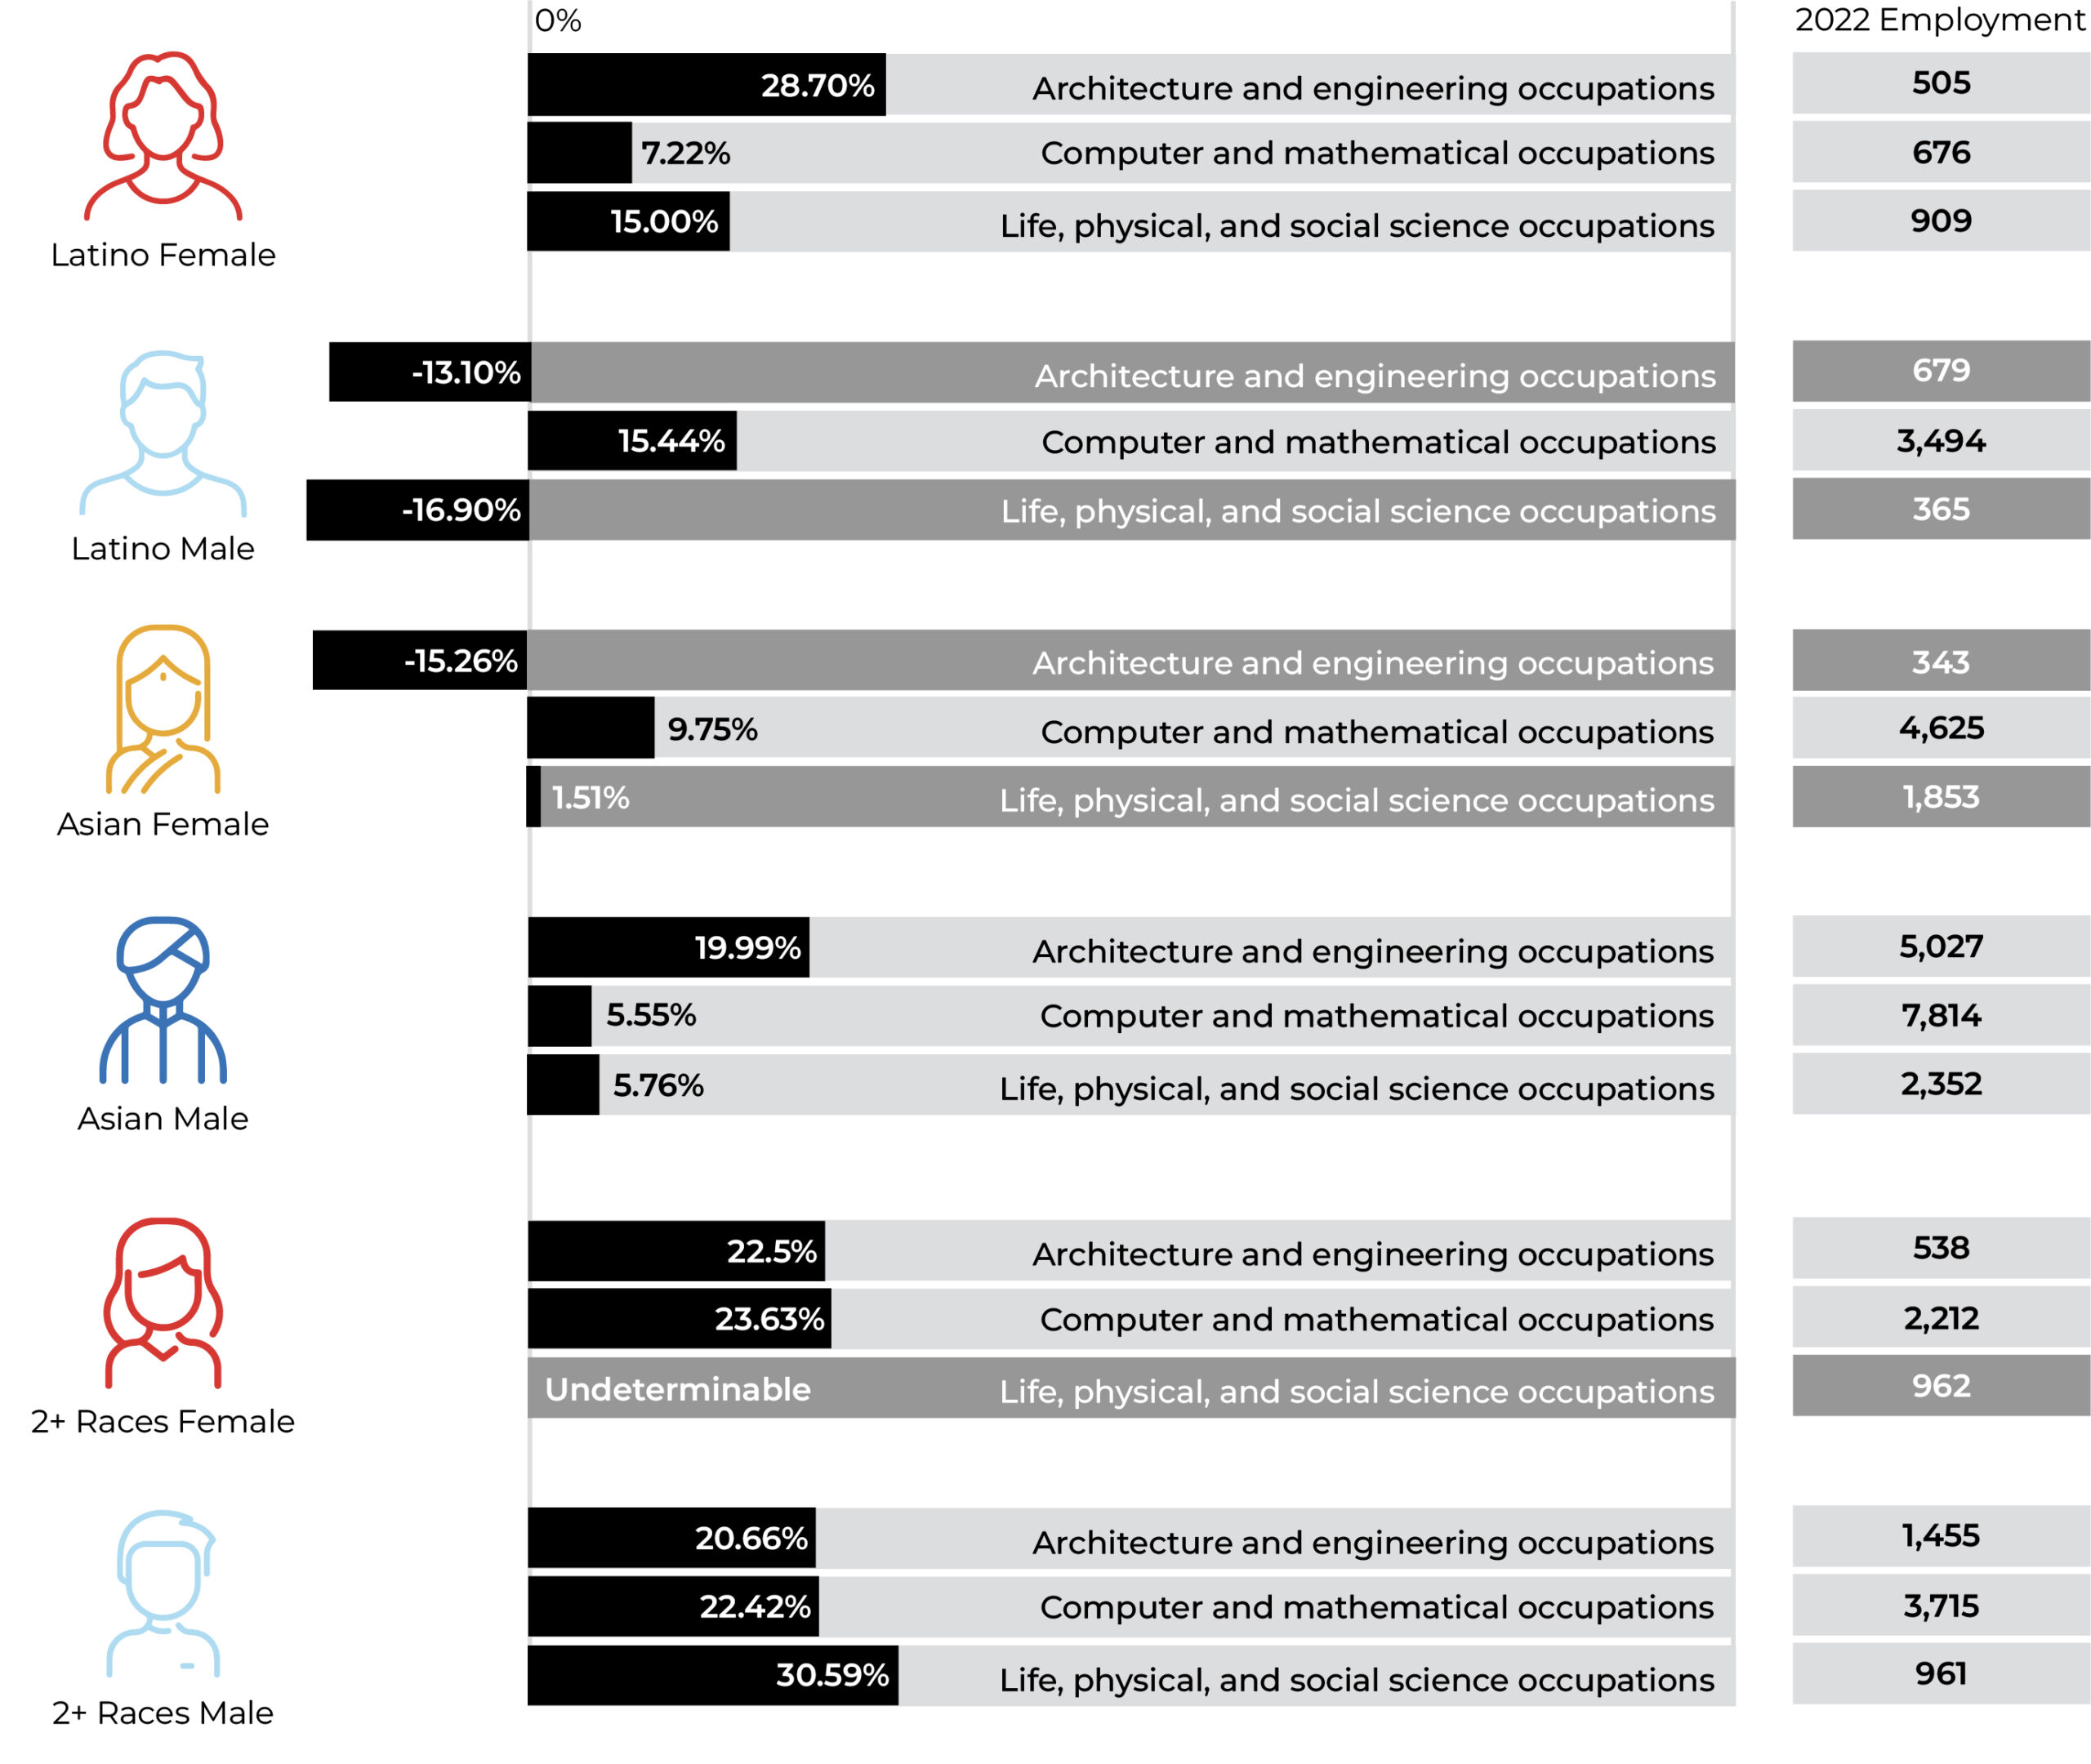
Employment Growth by Occupation Group, Race, Ethnicity & Gender
The ACS reports employment data on gender, several racial groups, and the Hispanic or Latino populations, when the geographic population of that group is greater than 50,000. Only the Black and White populations are included for Baltimore City. Note: dark gray shading indicates groups that are growing slower than the 4% annual target rate determined by TEDCO in the Maryland Innovation Competitiveness Study.
Baltimore MSA 5-Year CAGR

Baltimore City 5-Year CAGR

Baltimore MSA 5-Year CAGR Other Demographic Groups
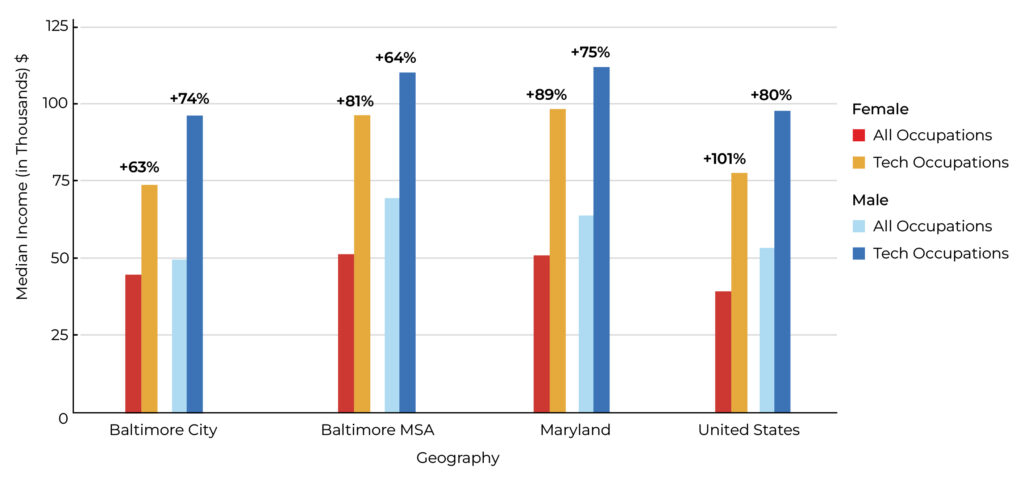
Tech Occupation Wage Premium by Gender
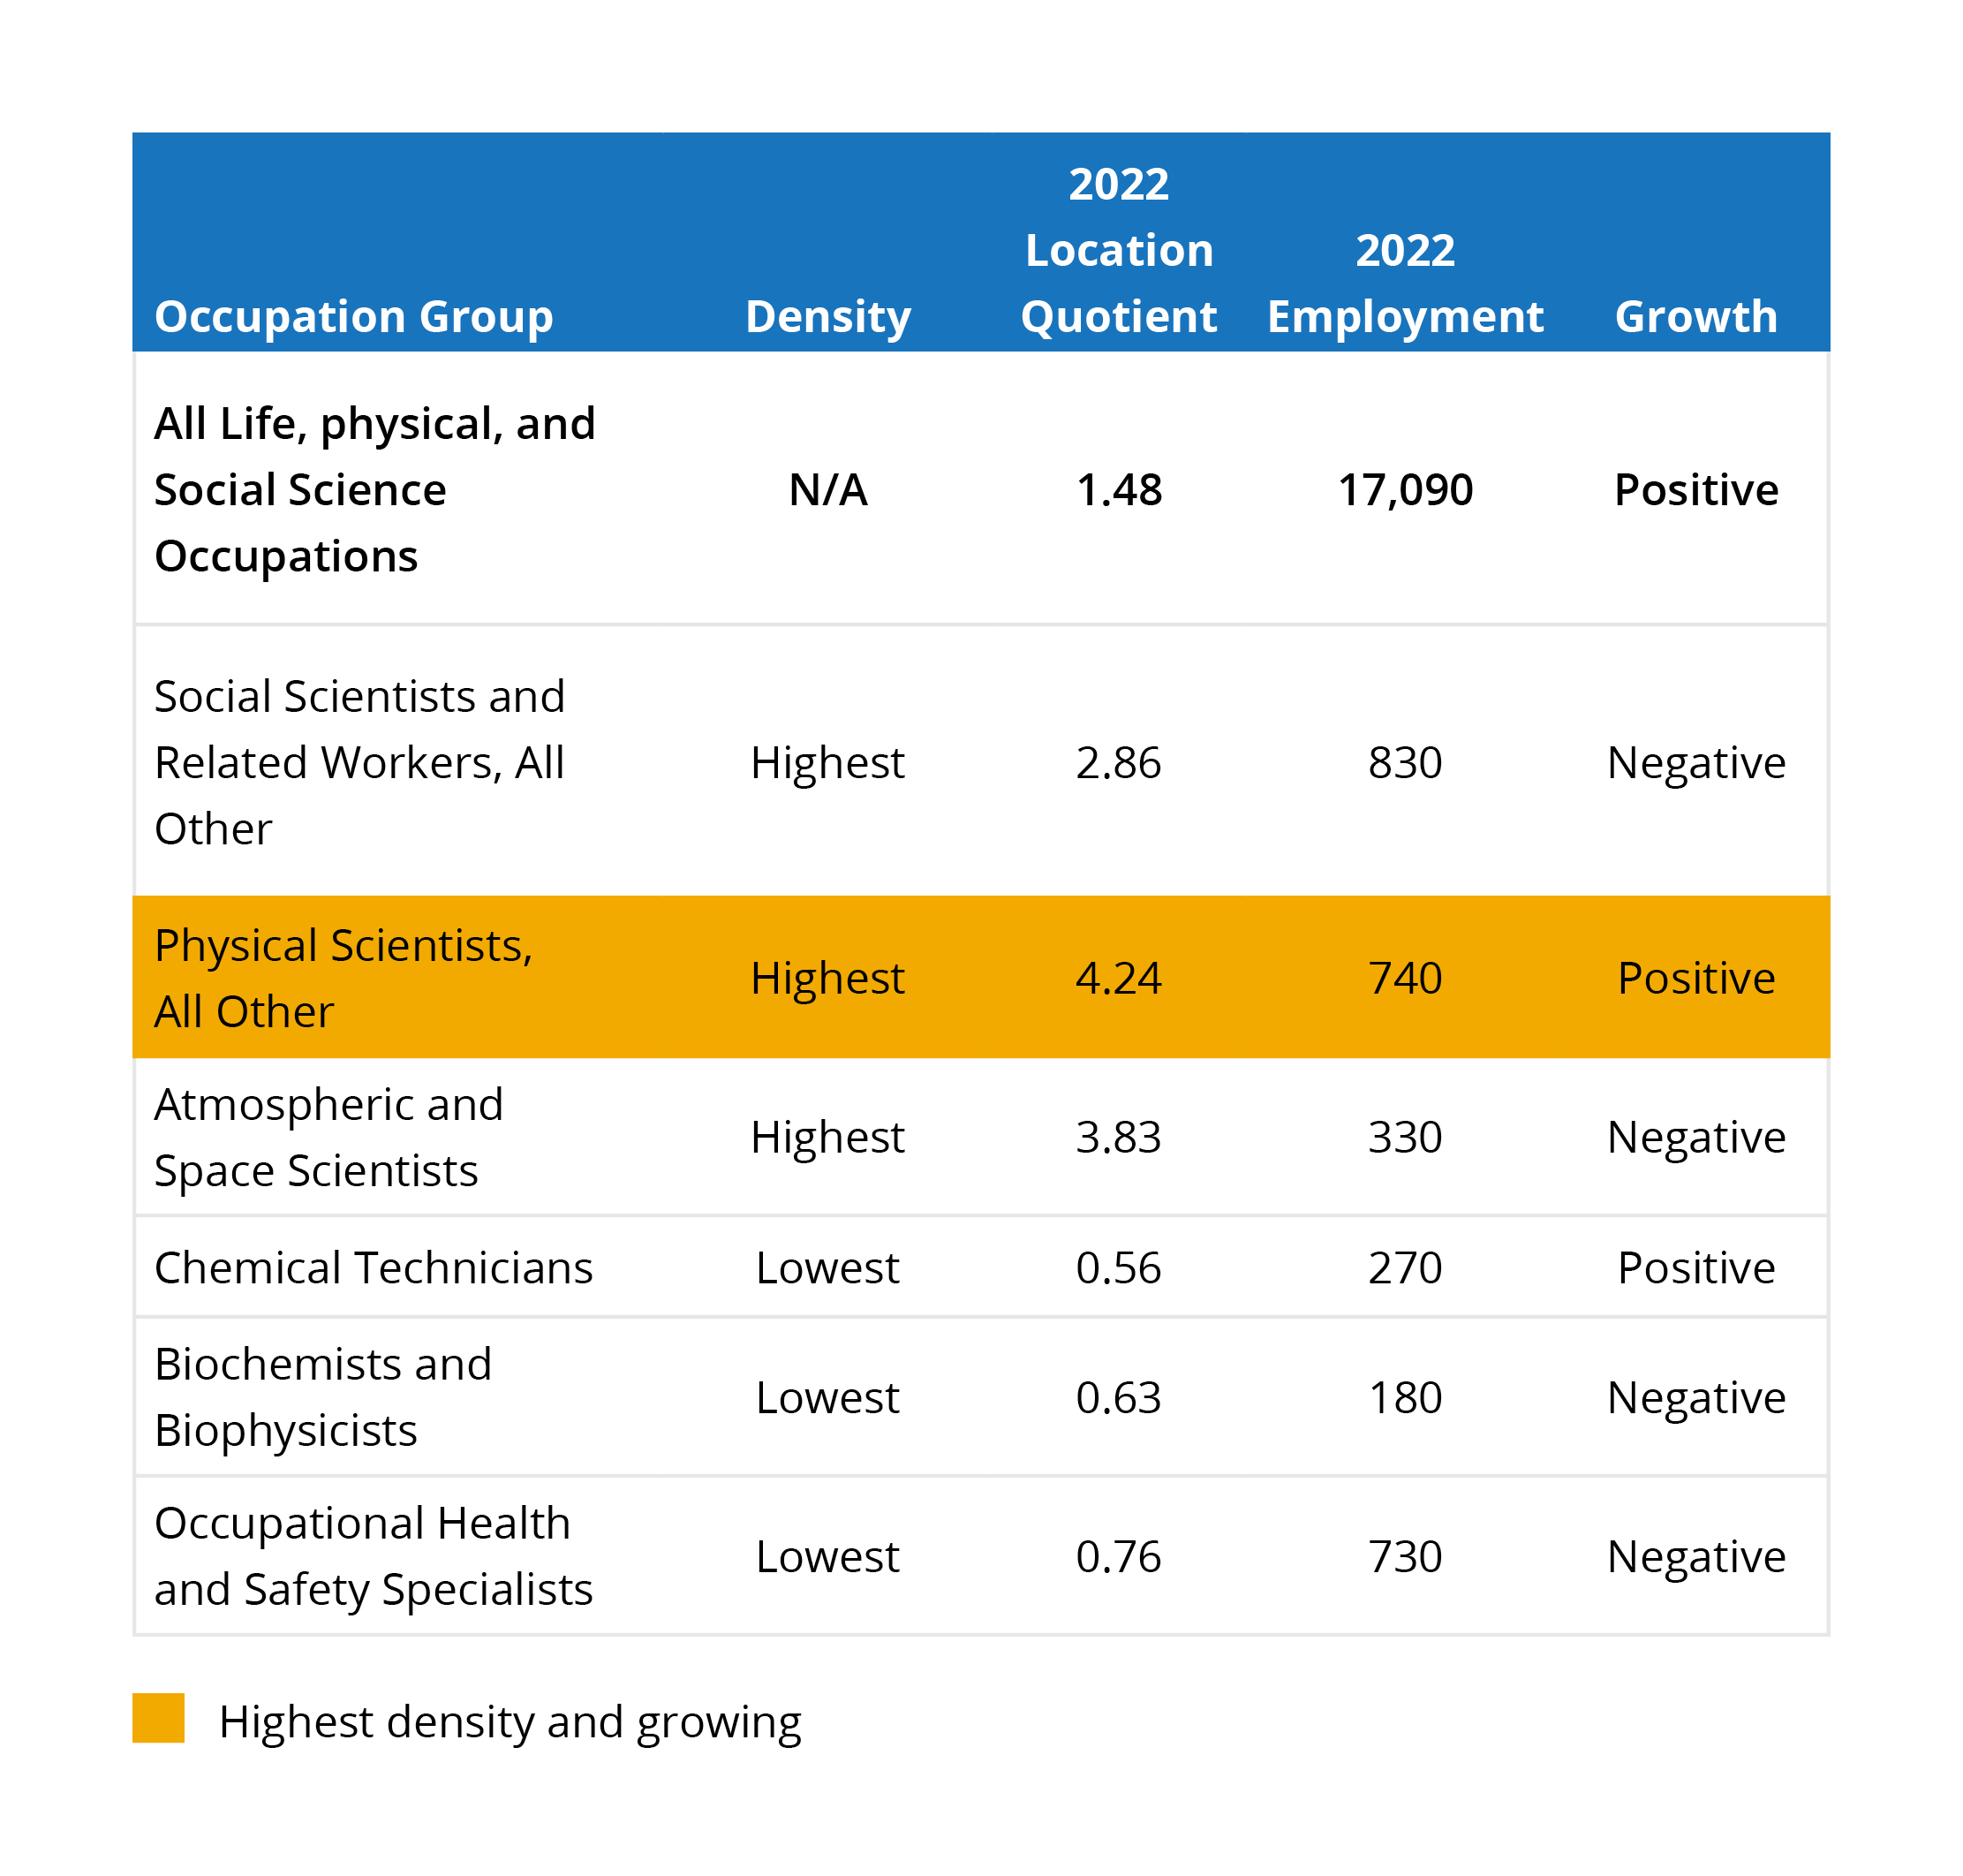
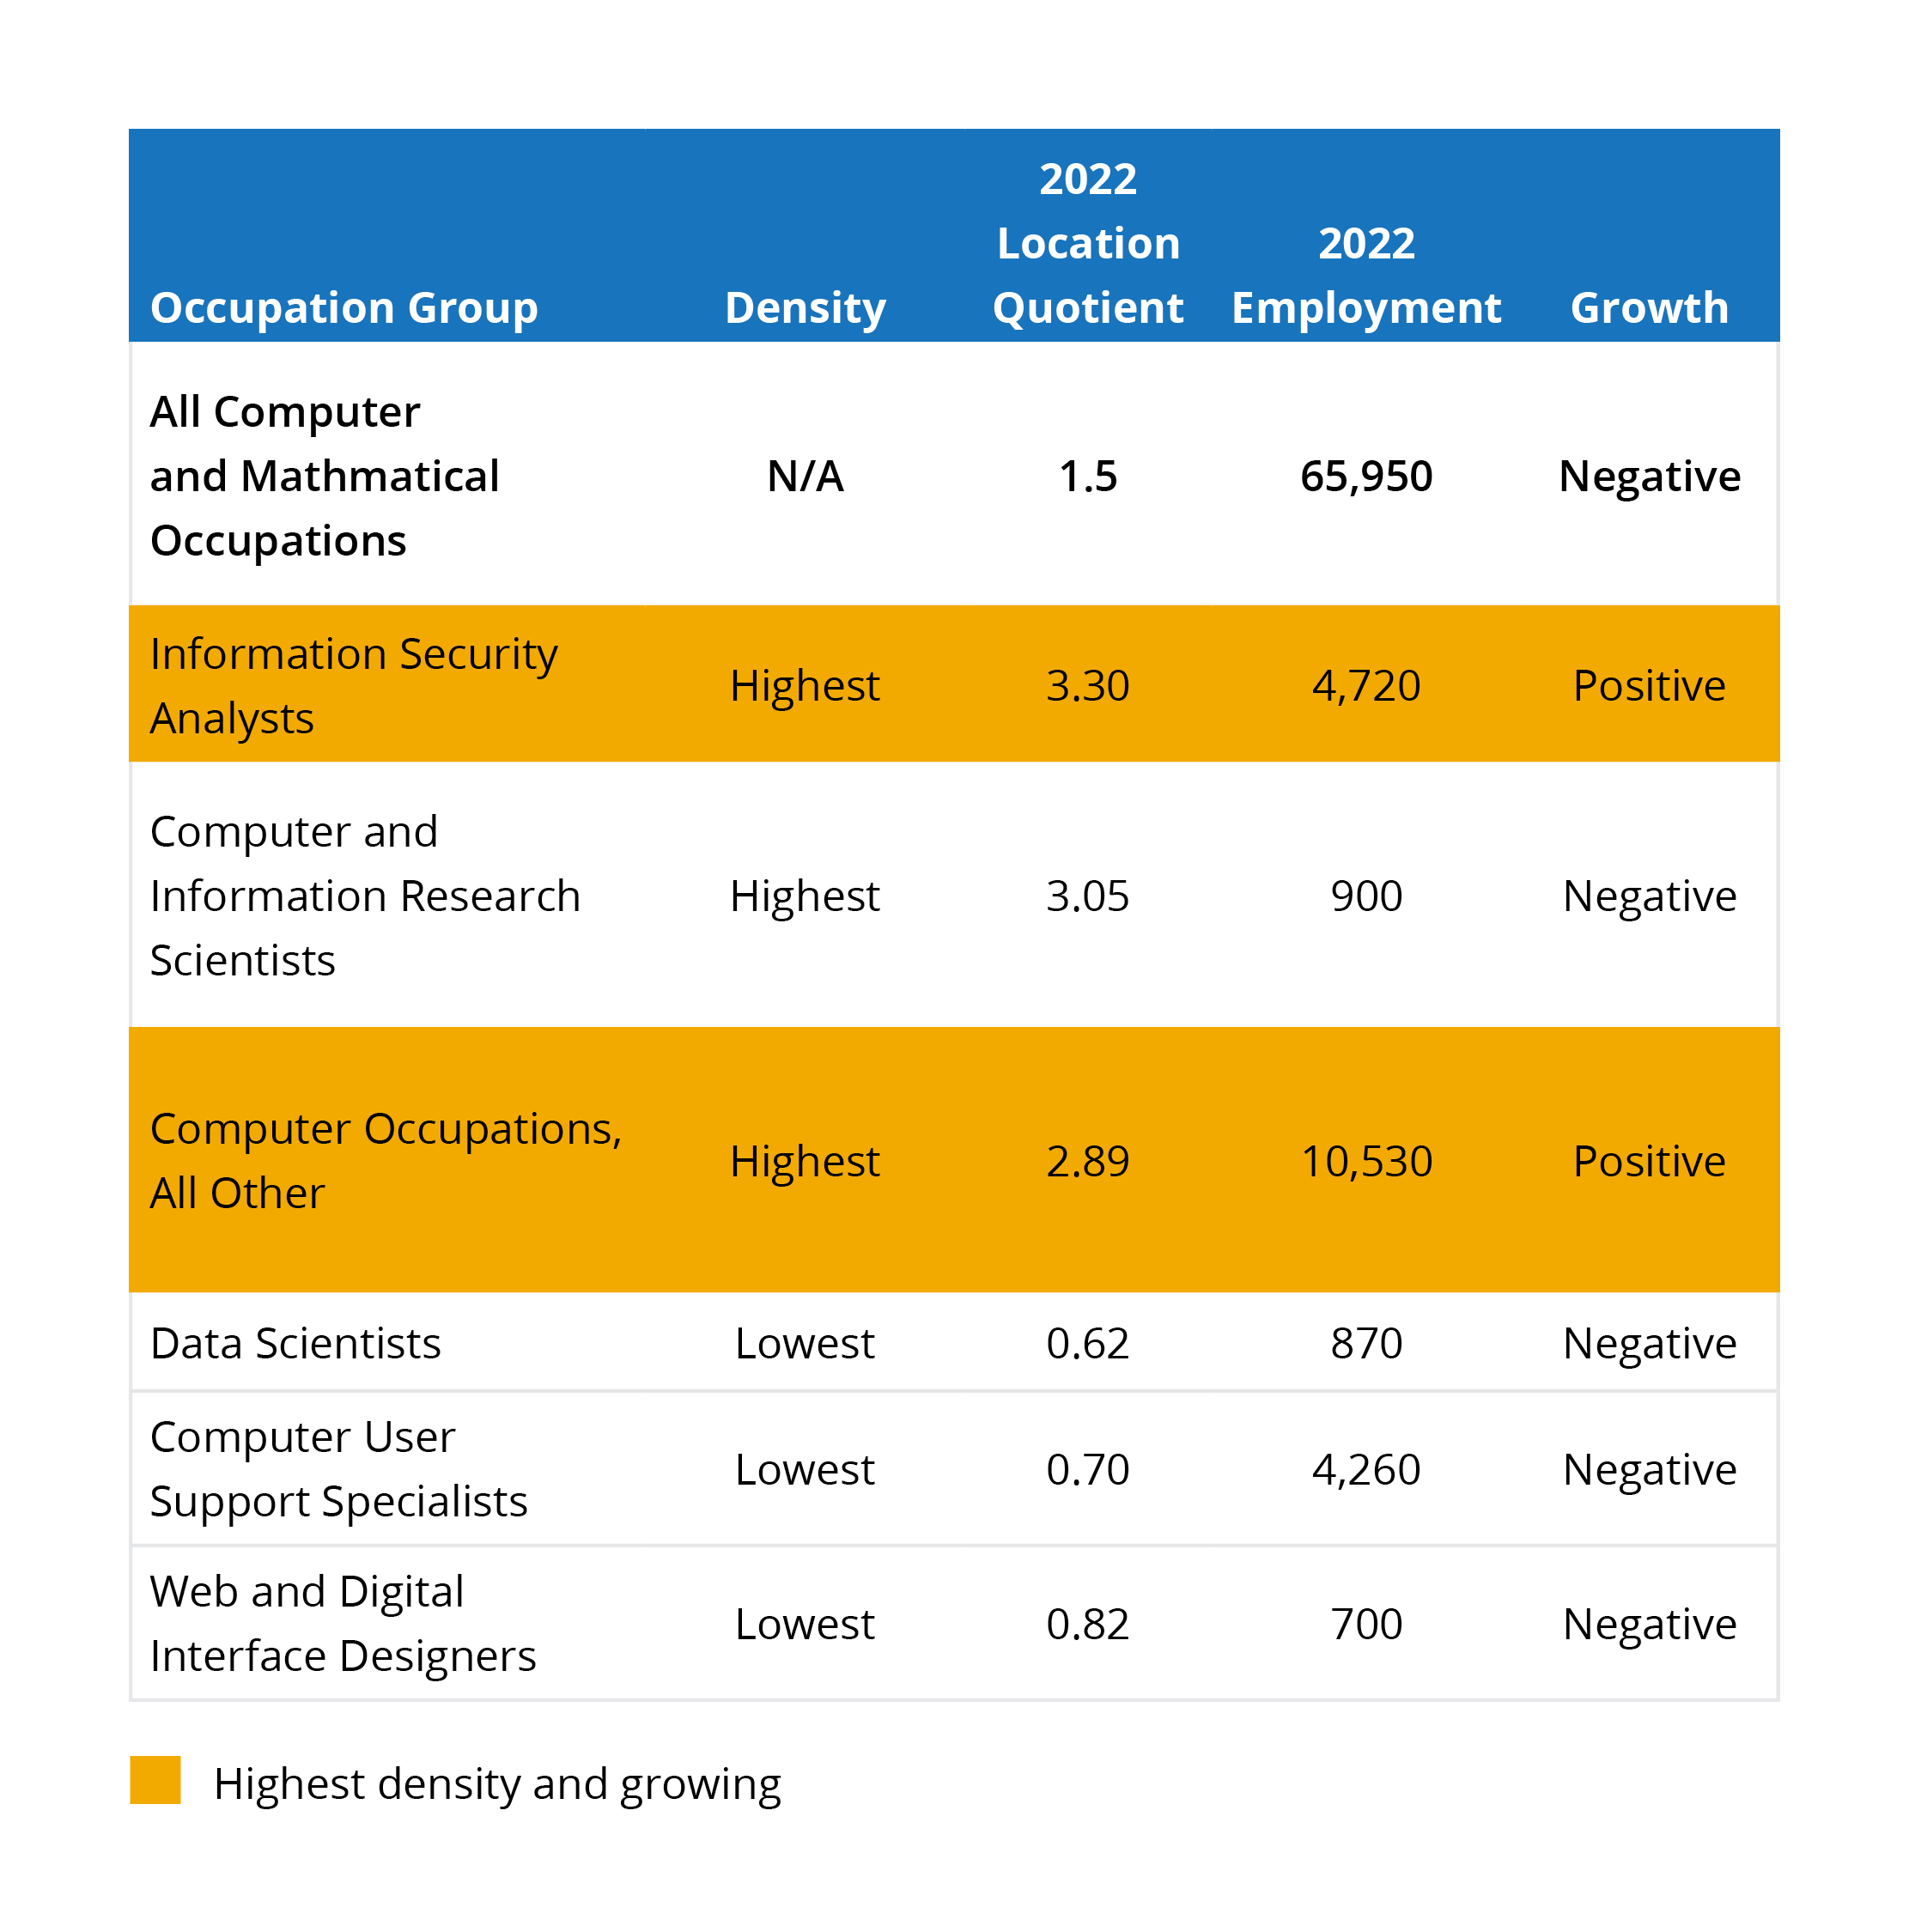
Tech Occupation Group Density
Occupation employment density is calculated in BLS’s Occupational Employment and Wage Statistics (OEWS) survey, which is reported by employers. The difference in the total tech employment reported by the OEWS survey and ACS is most likely due to people residing in the Baltimore MSA and working elsewhere in the DMV region which is home to nationally renowned tech institutions.
Architecture & Engineering Occupations

Computer & Mathematical Occupations
Life, Physical, & Social Science Occupations